
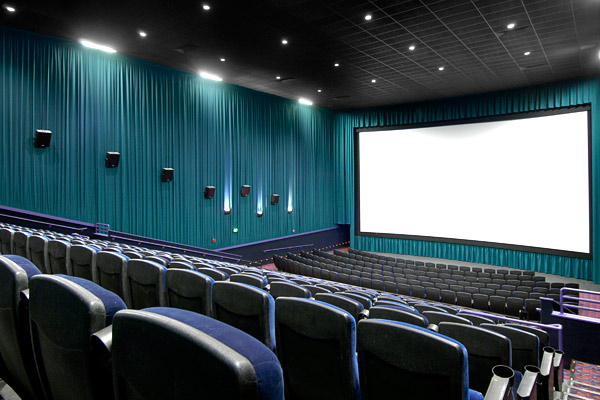
There is only really one thing I miss about living in the city and that is going to the cinema. Of course, I’d miss that even more if there were movies worth shelling out this month’s mortgage repayments to see. The idea of paying big bucks to sit in a seat that has probably been used for sex by strangers, eating snacks that have a 2000% markup, after forgetting your earplugs and going partially deaf, which is a blessing after the pre-movie ads, is just not that appealing. Now Australian cinemas have decided they aren’t charging movie goers enough money and have decided to blame an easy target to justify their cash grab.
Cinema executives have blamed piracy on the recent price rises of ticket prices in Australia. Because of course it is piracy that is to blame, and not the marginalising of the customer base with exorbitant pricing regimes. Nor could it possibly be that people have more alternate entertainment options, including waiting a few months to watch the latest “blockbuster” in their own home cinema. Nor could it be the rubbish that so many movie studios are turning out.
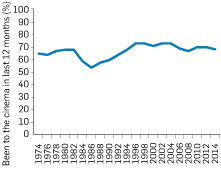
Let’s dissect this nonsense like the original reports in the media should have done. There are many factors at play in the decline of cinema. The first real problem is that there hasn’t really been a change in the proportion of the population that go to the cinema in 40 years, but the number of times per year they go has been steadily declining since the 90’s.
|
ATTENDANCE
(% BEEN TO THE CINEMA IN THE LAST 12 MONTHS)
|
FREQUENCY
(AVERAGE NO. VISITS PER YEAR)
|
|

|
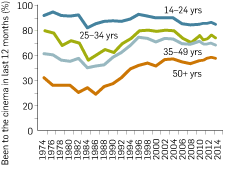
So rather than keeping audiences entertained regularly, audiences are clearly becoming more occasional customers. Underneath that general trend are some interesting changes in the demographics of cinema attendance. It is no secret that Hollywood movies are made for teenagers. Teens are a huge chunk of the cinema audience. But, the biggest change in the repeat attendees is in the teen market, which has been in steady general decline since the 70’s. Which part of the market is going to be most impacted by price rises? Go on: guess!
|
ATTENDANCE RATE
(% BEEN TO THE CINEMA IN THE LAST 12 MONTHS)
|
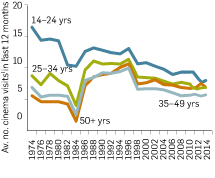
FREQUENCY
(AVERAGE NO. VISITS PER YEAR)
|
|
|
Another way to look at this is in the proportion of the population going to cinemas in the age demographics. Below you can see the 14-17 and 18-24 age groups are overrepresented as cinema goers, this starts to even out in the 25-34 group (also known as the settling down and going out less demographic), is at parity in the 35-49 group (also known as the parenthood has stolen my social life demographic), and people over 50 clearly don’t like all the loud noises.
AGE PROFILE OF CINEMA-GOERS COMPARED TO THE AUSTRALIAN POPULATION
OVER THE AGE OF 14, 2012

So while the proportion of the population that have been going to the cinema each year has been pretty steady across the entire population, it is the number of times people go that is making the difference, especially in that much coveted teen “I want to see explosions and car chases” market. (Interesting aside: when you look at the age group breakdowns you do see that the over 25 audience since the 70’s have generally increased in their likelihood to attend the cinema, but this has been static for most demographic groups since the mid 90’s.) To put some hard numbers on that difference in the number of times a teen goes to the cinema each year, in 1974 the 14-24 demographic averaged 16.4 visits to the cinema, in 2012 that had dropped to 6.6 visits.
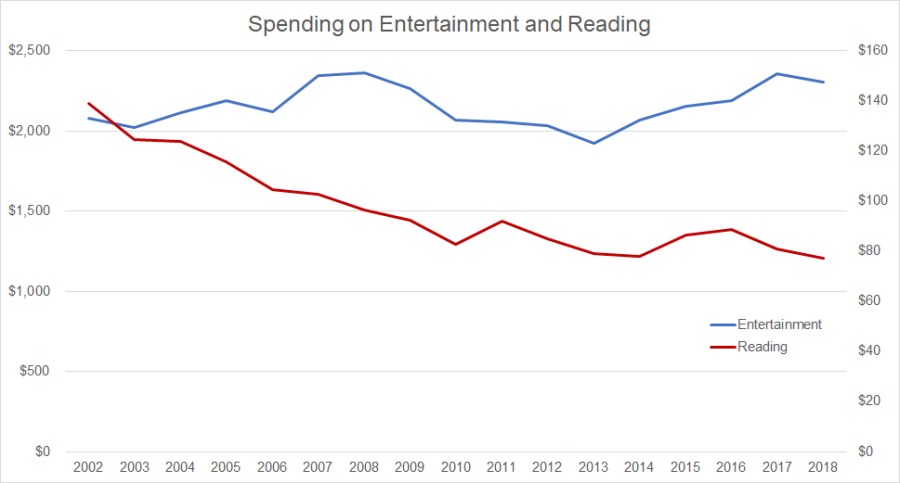
Obviously there are a lot of changes in the marketplace that have occurred over this time. TV has expanded, cable TV is a thing now, home rental or ownership of movies is a thing (VHS succeeded by DVD, now being superseded by Streaming, which will probably be superseded by actors coming to your house to perform on demand), computer games have grown in leaps and bounds, the internet, all vying for our attention and wallets. Just look at the change in households with various alternatives to cinema (NB: the game consoles data doesn’t tell the full gaming story, see this for more about that market):

I alluded to this above, but one big change has been the home cinema. Some people will remember a time when some cinema screens were actually not much bigger than the ones installed in many homes now. Sound systems have improved greatly over the crappy little speaker that was the drive-in experience. Now we have high quality TVs and projection units that rival anything you can get in a cinema complex, and these come with a pause function, easy access to food that doesn’t kill your wallet nor beat your heart with belly flab, and sound settings lower than jackhammer. Then you have all the other possible entertainment options available, suddenly the list of movies (not) to see just isn’t as appealing.
The one thing cinemas still have going for them is windowing. For the first few months after opening, there is no other (legal) way to watch the film, you have to watch it in the cinema or wait for the DVD release. Although it seems clear people are more willing to wait, let the dust settle after opening weekend, and figure out what is worth watching, whether that be at the cinema, on DVD, when it makes it to TV, or at all. And now I’m going to contradict myself and say that piracy proves people aren’t willing to wait for those other options, preferring simultaneous releases. Both arguments still point out that people just aren’t as interested in paying big(ger) bucks to see movies in the cinema. Of course movie studios and distributors don’t like that idea, since windowing is great for their bottom line, especially opening weekend.
Now the reason for the price rise could be something to do with this chart, showing that 21% of the market is in the highest income households. Cinemas are obviously betting that their price elasticity is low and will take the price increase in their stride. What this ignores is the age demographic data above, which shows a sizeable chunk of the audience may be from affluent households, but that doesn’t mean their teenage bank account is bulging with lots of cash.
So we see that cinema audiences are becoming more occasional consumers, the trip to the movies is a special event, not a regular event. Teens are a big chunk of the cinema market and they aren’t the repeat customers they used to be. This is what happens when you price customers out of the market, you bite the hand that feeds. You also have them turn to other entertainment mediums. Blaming piracy for what is demonstrably a long term trend is a pretty big reach. I’d also argue that piracy is a reaction to consumer demand for lower pricing and simultaneous releasing, so that audiences can consume the movies in the way they want to, not the way they are being forced to, at a price that is commensurate with the utility received (e.g. people pay as much or more for a DVD – less if you consider it a couple or family purchase). If cinemas have anyone to blame it is themselves and their suppliers (distributors and studios). Using piracy to justify a price increase is clearly unfounded.
Of course, what needs to be mentioned is that films are essentially a loss leader for cinemas so that they can make money selling snacks and beverages. This ticket price increase is probably driven through the supply chain rather than by the cinemas themselves. But this also shows how cinemas have to adapt in order to survive. Going out to a movie is an experience. People are more willing to pay for experiences rather than stuff (DVDs). So if cinemas can get serious about screening experience at a fair price, they might get the audience back, or at least stop the decline.
Sources: http://www.screenaustralia.gov.au/research/statistics/audiences.aspx
http://www.abs.gov.au/AUSSTATS/abs@.nsf/Lookup/4901.0Main+Features1Apr%202009?OpenDocument
http://www.abs.gov.au/AUSSTATS/abs@.nsf/Lookup/6530.0Main+Features12003-04%20(Reissue)?OpenDocument


