A few years ago I published a table from the US Bureau of Labor Statistics.
Wow, you sure know how to party!
Thanks.
Anyway, that table highlighted how much Americans spent on reading per year. Because I’m a Nerdus scientificus, for fun I decided to collate the stats in a spreadsheet and create some graphs.
You are just one big party animal, aren’t you!
I certainly am.
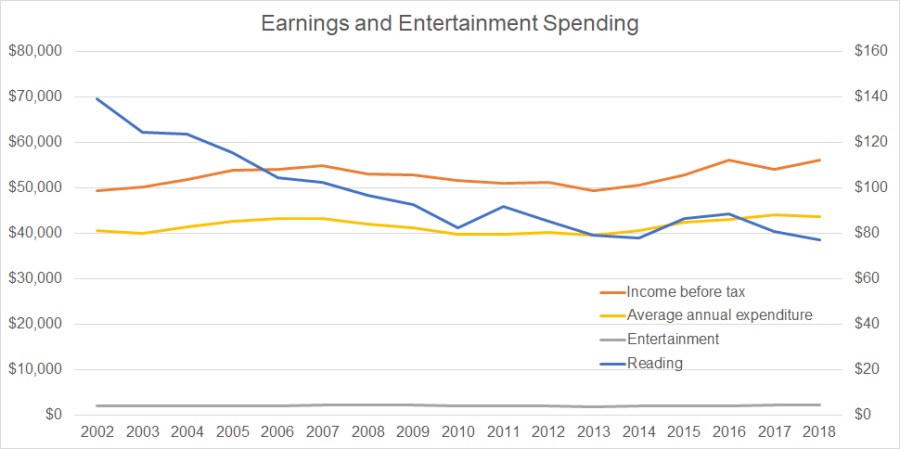
So the first chart is a summary of inflation-adjusted US income, expenditure, entertainment spend, and reading spend by the average “consumer unit”. A consumer unit is obviously the economists’ way of referring to a living, breathing, thinking, cog in the economic machine. Apply the appropriate conversion factors for your country.*
As you can see, US income and spending haven’t really changed in two decades in real terms. That’s right, despite more wealth having been created in the economy since 2000, the average cog in the machine hasn’t seen a change to their take-home pay. Sidenote: I noticed union membership is rather low in the US as well. Might be related.
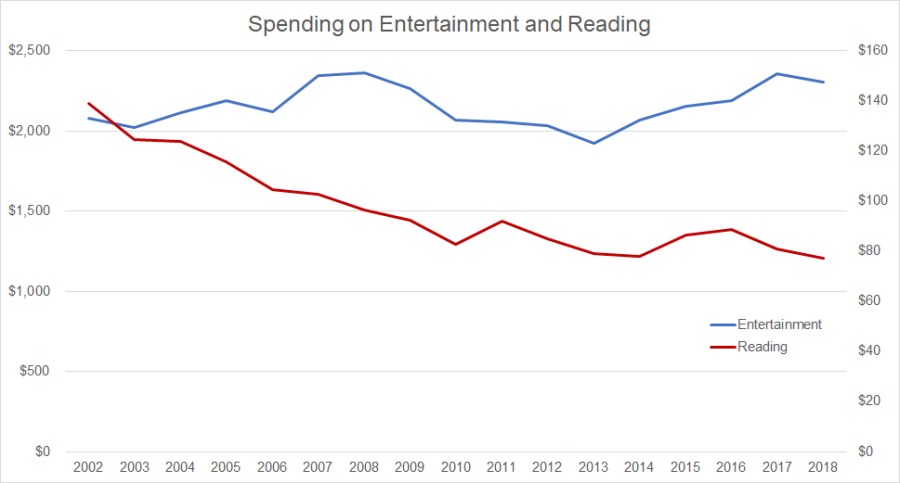
Over that same time period, the spending on reading has declined. The line for entertainment wasn’t particularly clear in the above chart, so I made this second one.
It could be argued that entertainment spend is roughly static over time, while reading spend is clearly declining in real terms. But the question is, what does this mean?
The obvious conclusion that Guardian columnists and other industry wonks will make is that (choose one or all to write your opinion column today!):
Kids these days are playing Facepage and Tweeters rather than reading books.
People have short attention spans and can’t handle reading decent books.
Too many people are Netflixing and Chilling.
Something derisive about gaming.
Blame falling education standards or immigrants or something.
Yes, the media landscape is more diverse now. This is a true fact, not an alternative one. But that doesn’t really explain the decline. Because reading also became cheaper over that time period. Amazon entered the market, heavily discounting paper books and shipped directly from the warehouse. E-books became a thing, which again changed the cost of buying books.
So you have to question how good a metric spending is to reading. Unless you are writing an industry opinion piece.
I also mentioned the lack of change in household income in real terms. It would be interesting to dig up some figures on financial stress for the average household over this same time period. And I’d posit that entertainment is more likely to involve passive forms, like television, than active forms like reading when stress is higher.
Ideally, the industry figures would be more transparent. That way someone could actually crunch the data and to track average individual book consumption and reading totals over time. Then we could put some opinion columnists out of work.
* By this I mean look at the currency conversions and think about whether you reckon your country-people would spend more or less of their household earnings on reading than an average American. More. The answer is going to be more. We’ve seen their leaders.
Recently I was reading an article in Aeon Magazine about the challenges faced by the medicine industry – commonly referred to as Big Pharma or Big Pharma written in one of those fonts with blood dripping from it and a syringe being stabbed into a baby. One of the big changes in medicine development discussed was the patent period that allowed monopolies on new drugs, which in turn saw orphan drugs – not drugs for Oliver “please sir, can I have some more” Twist, but drugs for rarer conditions and illnesses – become more popular/profitable to develop.
It’s an interesting issue and the article is worth reading. But it got me to thinking about something a little tangential. No, not whether Oliver Twist needs a remake set in south-east Asian sweatshops. I wondered how much money is actually spent on things.
Drug development appears to take a backseat to marketing. But this depends on what section of the market, how big the company is, and other factors. Clearly, medicine development is still a big expense, but how much is spent on research and development overall?
Total global pharmaceutical research and development spending from 2008 to 2022 (in billions of U.S. dollars) Source.
That global pharmaceutical research spending is quite large at $165 billion. Or is it?
Suddenly the amount spent on medicine research and development seems rather small. The USA government alone could easily cover the expense of medicine research if it decided to change priorities, since it spends 3.7 times that much on defence.*
Would it be a good idea for governments to have a Department of Pharmaceuticals that researched, developed, and sold medicines? Would that be money better spent than stockpiling tanks in a desert? Certainly, it would address several of the issues raised in the Aeon Magazine article around how the profitability of drugs, rather than the consumer needs, drives research and development.
This sort of thinking could be applied to many industries. The reality is that there isn’t actually a shortage of money but a lack of incentive to invest money in some areas in favour of others. The solution doesn’t have to be the government taking over, nor does it have to be about private companies not being profitable. But maybe it does have to be about rethinking what we spend money on.
Richard Denniss made similar arguments in his Quarterly Essay Dead Right about the Australian economy.
So maybe it is time to stop accepting the argument “we can’t afford X” and start having the discussion about how we spend for the most good. Or not, I’m not your boss.
*To be clear, I’m not suggesting we stop all spending on something like defense, or that there aren’t reasons for spending money on things like tanks. But as Richard’s video suggests, we are making value judgments and assumptions without really questioning them.
A few years ago I saw a fantastic talk from Hans Rosling about the world and statistics. Okay, I probably lost a few people by implying statistics are fantastic, and now I’ll lose some more by saying statistics ARE fantastic. Unfortunately, Hans is no longer with us, but his son and daughter-in-law – Ola and Anna – are continuing his work with Gap Minder.
That’s right, less than chance. People really don’t know that much about the world.
Do you think you could do better? Well, find out! Take the 2018 quiz here. Of course, this is the part where I say that I passed the test. Humble-brag. But in fairness, as I’ve already mentioned, I’ve been following Gap Minder and I like statistics.
Could you pass the test?
*They probably called it that prior, but I’m making a point here, dammit!
Sounds like a simple challenge, right? Name a book, any book at all.
In the long tradition of asking Americans general knowledge questions on the street and filming their glorious ignorance, I present this video from Jimmy Kimmel.
Before we all laugh and point at the Americans and insult their intelligence, let’s remember that you could do this just about anywhere. Although, Americans do make this stuff easy at times. I’ve previously discussed the reading figures for the US, UK, and Australia. I’m sure those numbers are at least in the same ballpark as other countries, if not outright representative.
Wait, why guess when I can actually use the wonders of the greatest information resource in human history to look that up? Why have an unfounded opinion that I then rant about in indignant outrage, arrogantly assuming I’m right and belittling anyone who does bother to look up the data? To the research!
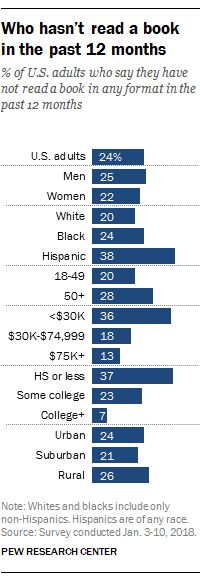
Let’s start with the data that the above video was citing from Pew Research.
As we can see, the 24% figure is showing that older, poorer, less educated, men (just), and Hispanics read less in the USA. This isn’t a new conclusion, as data from Pew in 2016 shows. The conclusion around the number who don’t read is also similar to the 2016 results of 26% not having read a book in the last 12 months. I’m not sure you can interpret much change over time in the number of people reading, but numbers might be slowly decreasing (although, look at the uptick in audiobooks as that format has come down in price).
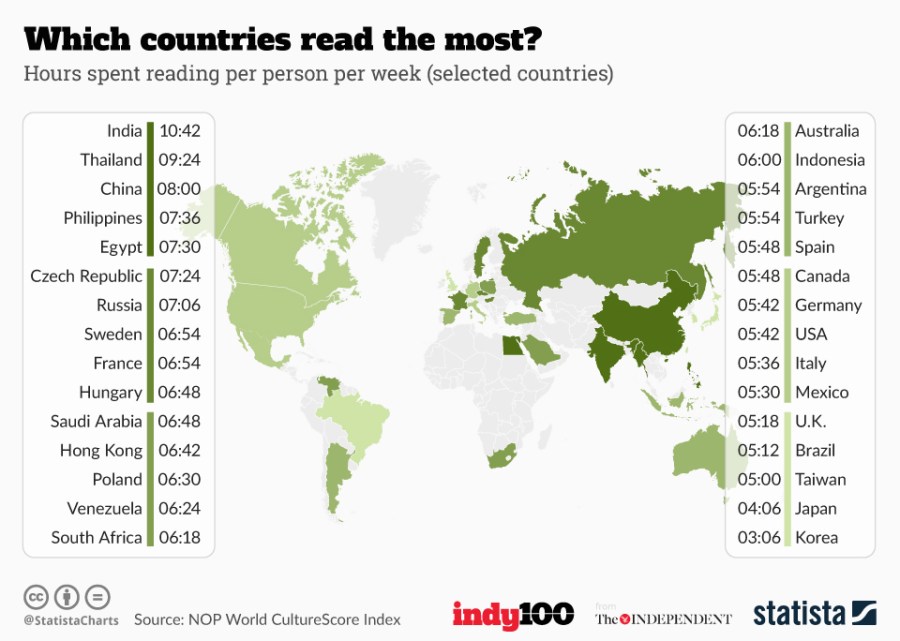
Now we can look at how the USA sits in terms of reading. I’ve previously discussed how Aussies spend roughly 23 minutes per day reading (ABS figures), or an hour a day if you believe the Australian Arts Council report (I suggested there was possible survey bias in that figure). Below you can see that the NOP World Culture Score puts Australia at 6 hours 18 minutes – which I think makes this an “ALL-YOU bench-press” set of numbers.
This chart suggests that the USA is probably typical for English speaking countries, but that many other countries read far more on a weekly basis in terms of hours. Unless reading is code for something else in non-English speaking countries. Maybe they thought they were being asked about how many hours they spent having sex per week.
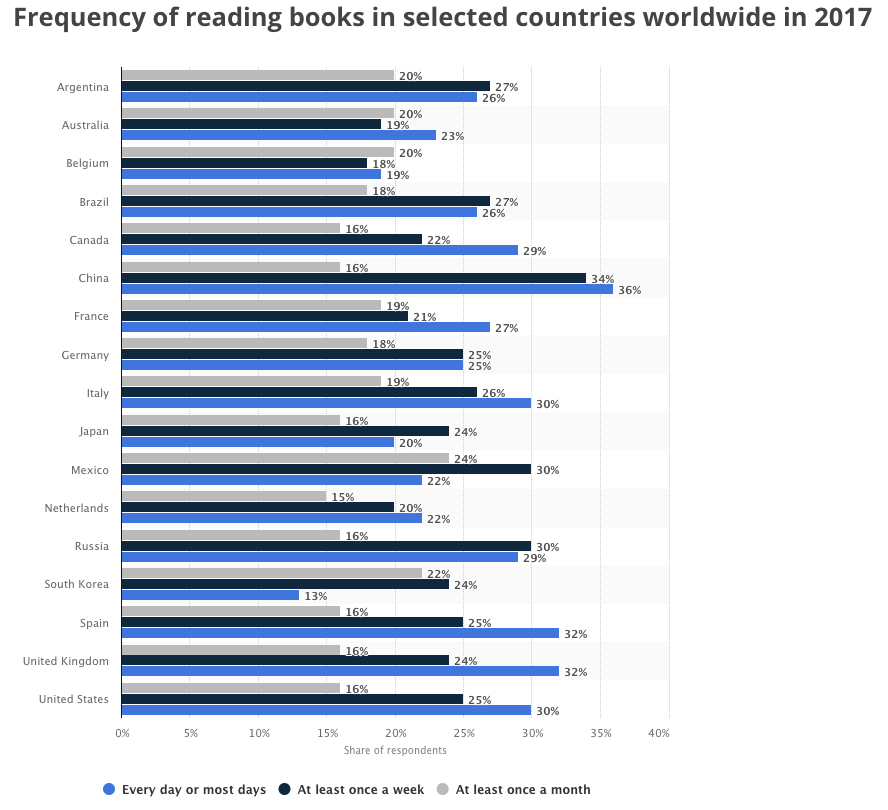
If we then look at the countries and how frequently they read books you can see in the chart below that they were afraid to include the bars for “didn’t read a book”. The high end has only 14% of Chinese people not reading a book, whilst the low end has the Dutch at 43% not reading (USA comes in at 29%, UK 28%, Australia 38% – I demand a recount!!).*
What this all shows is that there are plenty of countries where you could ask ten people on the street to name a book and have one or two of them fail. You could ask those ten people what book were they reading today and only three of them could. Isn’t that sad? I reckon people would really enjoy reading if they made time for it. I’ve commented before on why I think people don’t read, suggesting that they don’t because they get told to read literature when they actually enjoy thrillers, sci-fi, and romance.
Maybe it is time to change that before someone sticks a camera and microphone in our faces.
*Be careful with my assumption here. Depending on how the question was asked and any other unreported categories, I may be very wrong in assuming the unreported numbers are non-readers.
Penguin Australia recently published an article suggesting reading was awesome for your health. Previously I have posted science-backed articles on the benefits of reading (1, 2), so more science telling us that readers are awesome never goes astray. Although, as much as I love some good old confirmation bias, I can’t just share that article without some commentary from the further reading. I mean, the article title is a play on An apple a day keeps the doctor away… that can’t pass without some mockery.
Reading can provide hours of entertainment and pleasure, impart knowledge, expand vocabulary and give insight into unknown experiences. Additionally, research has shown that it has a variety of physical, mental and emotional health benefits. If you need another excuse to pick up a book, here are six ways reading can benefit your health.
And if those six reasons don’t encourage you to pick up a book, then think of them as six ways you’ll be superior to other people.
Improve brain function
Neuroscientists at Emory University in America conducted a study and discovered that reading a novel can improve brain function on a variety of levels. The study showed that when we read and imagine the settings, sounds, smells and tastes described on the page, the areas within the brain that process these experiences in real life are activated, creating new neural pathways.1 So next time you’re indulging in an armchair adventure with a great book, you could technically claim you’re working out – your brain, that is.
This study was rather small, consisting of 21 university aged participants who had 19 days of baseline brain scans before 9 days of scans as they read Robert Harris’ Pompeii novel. Warning: they had no null group in this study, only the baseline comparison, so any conclusions drawn should be done next to a salt shaker. It does, however, draw similar conclusions to previous research I’ve discussed.
Obviously, stimulating the brain by engaging with a story is going to light up parts of the brain, but there is the implication that using our brains in this way will strengthen pathways. Calling it a workout for the brain is probably a stretch because it isn’t like our brain sits around doing nothing the rest of the day. But for me, the more interesting thing is the shared response among participants. It proves Steven King’s adage true about writing being a form of telepathy.
The big unanswered questions here are how does this compare to any other shared activity, and how does it compare to other similar activities. I’d bet crypto money – always best to keep bets symbolic – that any other activities would see similar responses.
Increase longevity and brain health in old age
Researchers at Yale University School of Public Health found that, ‘reading books tends to involve two cognitive processes that could create a survival advantage.’ According to their results ‘a 20% reduction in mortality was observed for those who read books, compared to those who did not read books.’2 And the longer you live, the more time you have to get through your to-be-read pile.
This study nags at my skeptic-sense. Nothing immediately jumps out and screams “This study is nonsense, don’t believe it!” but I can’t help but feel like it is. They sampled 3,635 people in the USA and compared readers to non-readers for longevity. Don’t worry, they factored in stuff like age, sex, race, education, comorbidities, self-rated health, wealth, marital status, and depression. But I’m still left with the nagging sound of my statistics lecturer telling the class that correlation doesn’t equal causation. See this example about storks and babies!
My suspicion is that there is something unmeasured that is confounded with reading that is the actual causal factor. This factor is probably also available from other activities, thus other activities will also increase your lifespan. Just my suspicion. Happy to be proven wrong.
Reduce tension levels
A 2009 study by the University of Sussex found that reading for just six minutes can reduce tension levels by up to 68 per cent.3 Researchers studied a group of volunteers – raising their tension levels and heart rate through a range of tests and exercises – before they were then tested with a variety of traditional methods of relaxation. Reading was the most effective method according to cognitive neuropsychologist Dr David Lewis. The volunteers only needed to read silently for six minutes to ease tension in the muscles and slow down their heart rate. If ongoing stress is an issue take a look at these simple stress management tips.
This claim is hard to pin down. It’s not like other studies haven’t shown reading (and yoga, humour, cognitive, behavioural, and mindfulness) have impacts upon stress levels. But unlike the linked studies, Lewis’ study hasn’t been published. The source in the Canadian National Reading Campaign links to The Reading Agency in the UK which cites an article in The Telegraph. Now, I suspect that this was probably one of those studies done for a report that no one has read because the only publicly available material on it is the press release. But it could also be rubbish research that didn’t get published because of claims like 300% and 700% better than other activities sound like made-up numbers.*
Increase emotional intelligence & empathy
Numerous studies have shown that reading books can promote social perception and emotional intelligence.2 Studies have also found that when a person is reading fiction, they showed greater ability to empathize. Similar to the visualization of muscle memory in sports, reading fiction helps the reader use their imagination to put themselves in someone else’s shoes.1 For books that’ll test your empathy, push your moral boundaries and ask ‘what would you do?’, take a look at this collection.
I don’t know why they referenced the same two studies again as they didn’t look directly at the issue of emotional intelligence and empathy. I’ve seen better studies, such as the one I mentioned in my piece on Literary Fiction In Crisis, and this one that literary people like to wave around because they can’t afford a Ferrari. So while this appears to be true enough, it is worth understanding why (read this one and see how lots of books have differing levels of literary merit).
Improve sleep
While some scientists believe reading before bed can inhibit sleep due to heightened brain activity, researchers at Mayo Clinic recommend reading as part of a relaxing bedtime ritual that can help promote sound sleep.4 This, coupled with the tension-relieving benefits of reading, can vastly improve both the quality and quantity of your sleep. You may want to stay away from page-turning crime and thriller novels though – you could be up all night…
Clearly these people don’t read thrillers. Am I right people? Huh?
Anyway, it is worth reading what the Mayo Clinic actually said:
Prevention
Good sleep habits can help prevent insomnia and promote sound sleep: Create a relaxing bedtime ritual, such as taking a warm bath, reading or listening to soft music.
That’s right, it wasn’t that reading helped you sleep, it was that it could be part of a relaxing bedtime ritual. Could. They didn’t recommend it so much as used it as an example of a relaxing activity that wasn’t playing on the computer or watching TV (i.e. screen based). So this is overstating things a bit.
Improve overall wellbeing
Researchers at Italy’s University of Turin published an analysis of ten studies of bibliotherapy: the use of books as therapy in the treatment of mental or psychological disorders. Their findings showed that participants in six of the studies saw significant improvements in their overall wellbeing for up to three years after partaking in a course of reading therapy.5 With that in mind, here are some books to help you achieve mindfulness and find happiness in the everyday.
Worth reading the actual link on this one. In summarising they have made this sound like wellbeing benefits were being measured in most of the studies out to three years when only one of the ten studies did. This could just be me nitpicking, but it does overstate the results in my opinion.
As with many of my posts breaking down a sciency article, you can see that at best the claims are overstated, or as I’ve summed up previously I think you’ll find it is more complicated than that. And as much as I like reading – and I’m sure many of you reading this do as well – too often this sort of science isn’t actually helpful.
Sure, reading is awesome, but if you’re going to stick someone in an MRI to prove it, how about comparing it to other activities and including a nill treatment. That’s called good science! Readers don’t actually need some scientist to tell them their hobby is awesome (or maybe they do), and they especially don’t need overstated claims about that science in articles, it goes astray.
* Seriously, check out this “abstract” quote:
Abstract: Tested against other forms of relaxation, reading was proved 68% better at reducing stress levels than listening to music; 100% more effective than drinking a cup of tea, 300% better than going for a walk and 700% more than playing video games. Reading for as little as 6 minutes is sufficient to reduce stress levels by 60%, slowing heart beat, easing muscle tension and altering the state of mind. ‘Galaxy Commissioned Stress Research’, Mindlab International, Sussex University (2009)
With pork-barrelling season in full swing, we will be seeing plenty of politicians hitching their wagons to prominent sports and sporting teams. The proclamations that sports are True-blue, dinky-di, Aussie will come to win over voters, with a little somethin’ somethin’ in the budget to sweeten the deal. Because sport is king in Australia, right?
Aussies are routinely described as sports mad, sports addicts, and that we love watching and playing sports in sporty sports ways. But how many of us actually play sports? How many of us actually watch sports? Given that you could describe weekly matches of football as repeats of the same teams doing the same thing for months on end annually, it is worth taking a look at a few of our assumptions about the claims.
Let’s start with a look at how many Aussies play “sports”. Inverted commas around sports? Yes, because when people say that 60% (11.1 million) of Aussies play sports – down 5% compared to 2 years previous – what they actually mean is that we’re classifying walking and generally not sitting on the couch watching TV as sport. Let’s make it fairer on sports and subtract the walkers from being classified as sport participants. And let’s not succumb to temptation and call golf just more walking with intermittent cursing. That means that our 11.7 million “sports” participants is suddenly 7.5 million, which is 41.4% of the population (and falling with the ageing population). That figure sounds impressive until you realise that figure is participation of at least once in the past year and doesn’t account for the regularity of participation. How regularly someone is involved in sports is a much better indicator of our interest and love of sports. As opposed to accounting for that time you went to the gym because of a New Year’s resolution or because the doctor ordered you too out of concern for being dragged into an orbit around you at your next visit. The reality is that less than half of the population engage in regular (3 times per week on average) physical activity, with roughly a third of those people being gym junkies (NB: young men are more likely to play a sport, that drops with age and isn’t replaced with other activities, whilst women are more likely to be involved in non-organised sports and remain doing so).
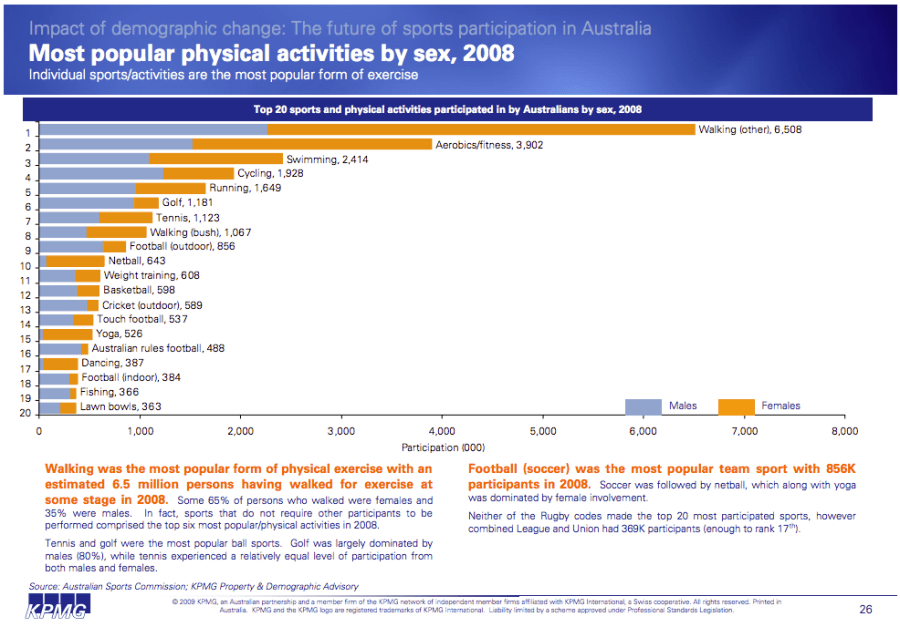
The Top 20 most popular physical activities are dominated by fitness activities like the already mentioned walking, aerobics/fitness, swimming, cycling, and running. One of the big name sports, AFL, ranks 16th on the list behind yoga. When yoga beats football for popularity it must only be a matter of time before the PM declares it the most exciting sport. For those wondering where rugby is on the list, the rest of Australia says ‘hi’.
Of course, this is only looking at sports. How does sports participation compare to other activities? Well, ABS figures show that we spend roughly 23 minutes a day reading, versus 21 minutes on sports and outdoor activities (NB: this varies between genders and age groups). The US figures show similar results with more time reading than playing sports, but they also spend less of their day on both activities. So at least we are still better read and fitter than Americans in the low barmetrics.
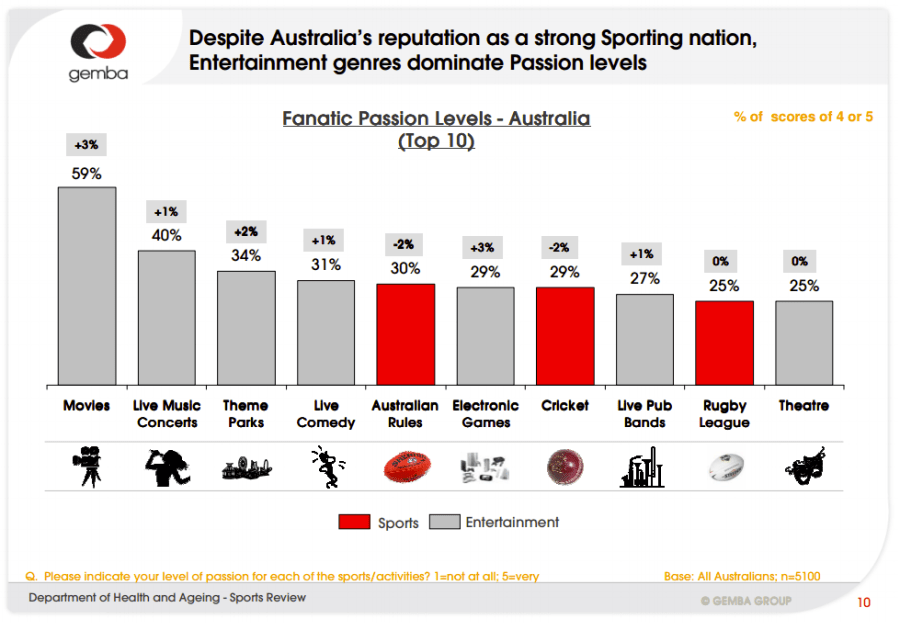
Obviously sports aren’t all about participation and most would regard themselves as avid armchair sportspeople. It could be argued that the best way to stay injury free in sports is to participate from the comfort of the couch in front of the TV at home. The other option is to attend a sporting stadium dressed in clothes made from random assortments of gaudy colours to cheer on a team who are wearing similar clothes but are less inebriated. Or would the most appealing option be to go to a movie, concert or theme park? The correct answer is that people would prefer to attend a movie (59%), a concert (40%), or a theme park (34%). Live Comedy (31%) was more popular than Football (30%), Cricket (29%) and Rugby (25%).
Of course, someone is bound to point to spectator numbers for AFL, A-League, and NRL that look very impressive. With average match attendances in the tens of thousands, and millions annually, sports are clearly important.
At a glance the figures look mildly impressive, but much like enhancement pouch underwear, things aren’t nearly as impressive when you look at the attendance figures in the cold light of day.
Even if we disregard the doubling up and totalling of attendance occurring in the stats, it is easy to see that even the most popular sport in Australia would rank behind visiting Botanic gardens, zoos and aquariums, and libraries. They aren’t even in the same ballpark as cinema attendance. But we can go deeper on the reading, library and cinema figures, even getting frequency statistics so we can tell the difference between the people doing something “at least once” versus people doing something regularly in the past year. 47.7% of people are reading a book weekly, 70% of library attendees (mostly women) visited at least 5 times in the past year, 65% of Australians are (computer) gamers, and 65% of Aussies go to the cinema an average of 6-7 times a year. And yet sport has a segment in news broadcasts whilst reading, gaming, and parks and zoos battle to get media coverage. Technically if we wanted to be fair then the sport segment would be cut to make way for movie news and a live cross to the local library.
What about the economy? How much are households spending on sports? That’s a great question and a great segue into a discussion of howtrickle-down economicsdoesn’t work in sports either. I mean, funding sports that way when it hasn’t worked in the economy must be a no-brainer, right? [Insert low IQ athlete joke here] Or we could stay on topic and discuss the $4.4 billion sports and physical recreation spend by households annually. Let’s not complicate things by talking about the buying of stuff like footwear, swimming pools, and camper vans. Seriously, camping is in the sport spending category? Either way, $4.4 billion sounds like a lot of money, until you realise that gaming is a $3 billion industry, and that households spend $4.1 billion on literature and $4.7 billion on TV and film.
We allow governments to spend a lot of money on big sports and big sporting events. Think that hosting the Olympics will encourage people to play sports? Nope. Actually, seriously, nope. One report described this idea as nothing more than a “deeply entrenched storyline”, sort of like a fairy tale handed down from one Minister for Sport to the next. Part of the problem is that we buy this narrative hook, line, and sinker, such that the sports themselves (and surrounding data agencies) never really bother to keep statistics to prove the claims. But they make for great announcements and ribbon cutting events on the election campaign trail, so the myth keeps on keeping on.
Ultimately the argument isn’t that sports are unpopular or bad but rather that we spend an inordinate amount of time pretending we like them far more than the reality. And that is impacting our elected officials more than a chance to wear a high-viz vest at a press conference. Maybe it is time to rethink what media and funding we throw at sports, and perhaps consider a gaming segment on the news.
So this pork-barrelling season look forward to the announcement of a new multi-million dollar yoga stadium in a marginal electorate near you.
Update: Charlie Pickering and The Weekly team cover some similar points for the Grand Prix events in Australia.
NB: I haven’t covered sports injuries, particularly how over half a million Aussies have long term health conditions as a result of sport. Please see this report for more.
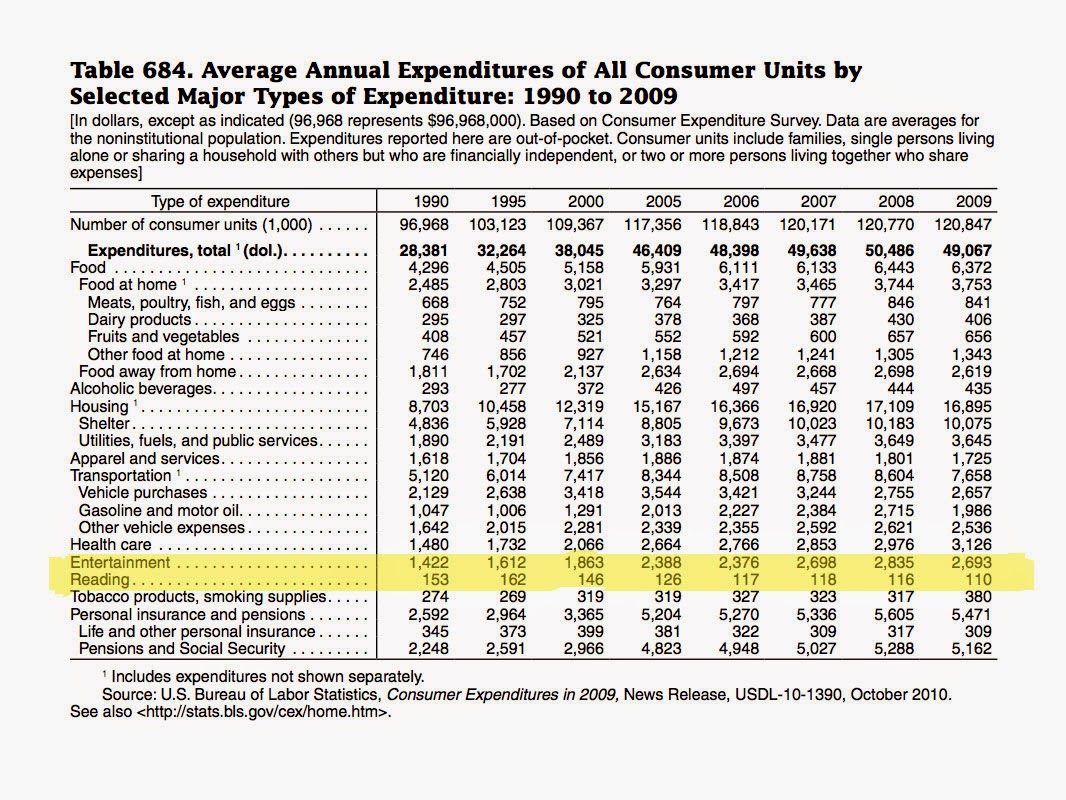
An interesting table of statistics – yes I am assuming statistics are interesting, why yes, I am a huge nerd – crossed my feed today. The table, presented below, shows the household expenditure breakdowns over time (1990-2009). The highlighted lines show the amounts spent on entertainment and reading.
US Bureau of Labor Statistics (with labour spelt incorrectly)
For those of you who are blind or prefer reading my words rather than a table of numbers, the statistics show that since 1990 there has been a pretty steady increase in household expenditure on entertainment, but the amount spent on reading has been in steady decline. Clearly it is time to panic. Movies, TV and gaming have won. Time to give up reading and writing. No future in it.
Well, that would be the conclusion if you don’t go and look for the source data.
Now I am rather lazy, so I haven’t bothered to look up every year of data and tried to recreate the table. But what I have done is looked up the figures from a few of the years not included in the table: 2010, 2011, 2012 and 2013. The spend on reading from those years is $100, $115, $109 (no 2013 data as yet) and entertainment spend of $2,504, $2,572, $2,605 and $2,482. Seems like that trend stopped, or something.
Actually, the trend has more to do with the household demographics and income than any change in book buying. Whilst in the early 2000’s there was a drop in reading for entertainment from ~0.4% of household expenditure to ~0.2%, this has been consistent since. So readers are still buying and reading books at roughly the same proportion as always.
And who are the readers? Well, from the demographics breakdown the readers tend to be middle-aged or older, higher income, educated households, or households without kids. Apparently having kids stops you reading, can’t think why. And clearly older and more affluent people are the ones who can afford the hardcover prices, or see the value in them, or just like having something on the bookshelf surrounding their money pile – rich people have money piles in their houses, right?
To me this doesn’t say reading is a dying industry, rather that there are groups being missed by the current industry. Of course I’m biased and probably daydreaming about a magical place where books hunt down DVDs for sport. The younger people tend to have less entertainment expenditure, with the average consumer spending 5% of their income on entertainment, whilst under 25s spend between 4 and 5%. Their book buying appears to have declined and is lower than the average consumer, at 0.14% (2012). This makes them a missed market (or possibly buying cheaper e-books). The other groups spending less on books are the less educated and lower income people, and again, not just in total expenditure but in the proportion of household expenditure.
Clearly these three groups could be reading just as much but instead of buying books they are borrowing them from friends or libraries, or they might be buying cheaper books. But something tells me this isn’t the case, what with the kids these days with their hippity hop music and haircuts. To my mind the fear that the market for books is shrinking, as suggested by the above table, is not borne out by the more recent data. We see more competition for entertainment dollars yet books don’t change that much ($150 to $110 over 22 years is 3 paperbacks in the US) suggesting that the problem is in who is reading. If reading is going to be only for richer, older and more educated people then we have a problem, especially if we aren’t creating the next generation of readers.
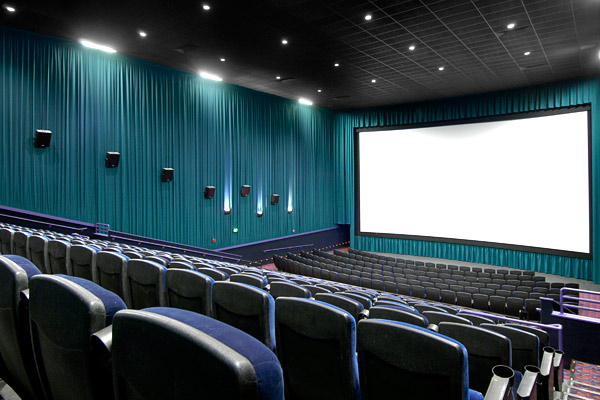
There is only really one thing I miss about living in the city and that is going to the cinema. Of course, I’d miss that even more if there were movies worth shelling out this month’s mortgage repayments to see. The idea of paying big bucks to sit in a seat that has probably been used for sex by strangers, eating snacks that have a 2000% markup, after forgetting your earplugs and going partially deaf, which is a blessing after the pre-movie ads, is just not that appealing. Now Australian cinemas have decided they aren’t charging movie goers enough money and have decided to blame an easy target to justify their cash grab.
Cinema executives have blamed piracy on the recent price rises of ticket prices in Australia. Because of course it is piracy that is to blame, and not the marginalising of the customer base with exorbitant pricing regimes. Nor could it possibly be that people have more alternate entertainment options, including waiting a few months to watch the latest “blockbuster” in their own home cinema. Nor could it be the rubbish that so many movie studios are turning out.
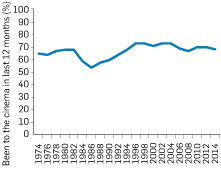
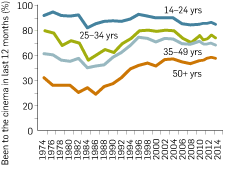
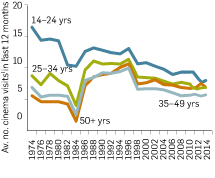
Let’s dissect this nonsense like the original reports in the media should have done. There are many factors at play in the decline of cinema. The first real problem is that there hasn’t really been a change in the proportion of the population that go to the cinema in 40 years, but the number of times per year they go has been steadily declining since the 90’s.
ATTENDANCE
(% BEEN TO THE CINEMA IN THE LAST 12 MONTHS)
FREQUENCY
(AVERAGE NO. VISITS PER YEAR)
So rather than keeping audiences entertained regularly, audiences are clearly becoming more occasional customers. Underneath that general trend are some interesting changes in the demographics of cinema attendance. It is no secret that Hollywood movies are made for teenagers. Teens are a huge chunk of the cinema audience. But, the biggest change in the repeat attendees is in the teen market, which has been in steady general decline since the 70’s. Which part of the market is going to be most impacted by price rises? Go on: guess!
ATTENDANCE RATE
(% BEEN TO THE CINEMA IN THE LAST 12 MONTHS)
FREQUENCY
(AVERAGE NO. VISITS PER YEAR)
Another way to look at this is in the proportion of the population going to cinemas in the age demographics. Below you can see the 14-17 and 18-24 age groups are overrepresented as cinema goers, this starts to even out in the 25-34 group (also known as the settling down and going out less demographic), is at parity in the 35-49 group (also known as the parenthood has stolen my social life demographic), and people over 50 clearly don’t like all the loud noises.
AGE PROFILE OF CINEMA-GOERS COMPARED TO THE AUSTRALIAN POPULATION
OVER THE AGE OF 14, 2012
So while the proportion of the population that have been going to the cinema each year has been pretty steady across the entire population, it is the number of times people go that is making the difference, especially in that much coveted teen “I want to see explosions and car chases” market. (Interesting aside: when you look at the age group breakdowns you do see that the over 25 audience since the 70’s have generally increased in their likelihood to attend the cinema, but this has been static for most demographic groups since the mid 90’s.) To put some hard numbers on that difference in the number of times a teen goes to the cinema each year, in 1974 the 14-24 demographic averaged 16.4 visits to the cinema, in 2012 that had dropped to 6.6 visits.
Obviously there are a lot of changes in the marketplace that have occurred over this time. TV has expanded, cable TV is a thing now, home rental or ownership of movies is a thing (VHS succeeded by DVD, now being superseded by Streaming, which will probably be superseded by actors coming to your house to perform on demand), computer games have grown in leaps and bounds, the internet, all vying for our attention and wallets. Just look at the change in households with various alternatives to cinema (NB: the game consoles data doesn’t tell the full gaming story, see this for more about that market):
I alluded to this above, but one big change has been the home cinema. Some people will remember a time when some cinema screens were actually not much bigger than the ones installed in many homes now. Sound systems have improved greatly over the crappy little speaker that was the drive-in experience. Now we have high quality TVs and projection units that rival anything you can get in a cinema complex, and these come with a pause function, easy access to food that doesn’t kill your wallet nor beat your heart with belly flab, and sound settings lower than jackhammer. Then you have all the other possible entertainment options available, suddenly the list of movies (not) to see just isn’t as appealing.
The one thing cinemas still have going for them is windowing. For the first few months after opening, there is no other (legal) way to watch the film, you have to watch it in the cinema or wait for the DVD release. Although it seems clear people are more willing to wait, let the dust settle after opening weekend, and figure out what is worth watching, whether that be at the cinema, on DVD, when it makes it to TV, or at all. And now I’m going to contradict myself and say that piracy proves people aren’t willing to wait for those other options, preferring simultaneous releases. Both arguments still point out that people just aren’t as interested in paying big(ger) bucks to see movies in the cinema. Of course movie studios and distributors don’t like that idea, since windowing is great for their bottom line, especially opening weekend.
Now the reason for the price rise could be something to do with this chart, showing that 21% of the market is in the highest income households. Cinemas are obviously betting that their price elasticity is low and will take the price increase in their stride. What this ignores is the age demographic data above, which shows a sizeable chunk of the audience may be from affluent households, but that doesn’t mean their teenage bank account is bulging with lots of cash.
Equivalised gross household income quintiles
No. cinema-goers (‘000)
Share of cinema-goers (%)
Attendance rate (%)
Lowest quintile
1,010.6
9.7%
47.2%
Second quintile
1,305.6
12.5%
50.8%
Third quintile
1,879.1
18.0%
66.6%
Fourth quintile
2,106.4
20.2%
75.3%
Highest quintile
2,199.2
21.1%
80.0%
Unknown
1,930.5
18.5%
65.8%
Total
10,431.4
100%
65.2%
So we see that cinema audiences are becoming more occasional consumers, the trip to the movies is a special event, not a regular event. Teens are a big chunk of the cinema market and they aren’t the repeat customers they used to be. This is what happens when you price customers out of the market, you bite the hand that feeds. You also have them turn to other entertainment mediums. Blaming piracy for what is demonstrably a long term trend is a pretty big reach. I’d also argue that piracy is a reaction to consumer demand for lower pricing and simultaneous releasing, so that audiences can consume the movies in the way they want to, not the way they are being forced to, at a price that is commensurate with the utility received (e.g. people pay as much or more for a DVD – less if you consider it a couple or family purchase). If cinemas have anyone to blame it is themselves and their suppliers (distributors and studios). Using piracy to justify a price increase is clearly unfounded.
Of course, what needs to be mentioned is that films are essentially a loss leader for cinemas so that they can make money selling snacks and beverages. This ticket price increase is probably driven through the supply chain rather than by the cinemas themselves. But this also shows how cinemas have to adapt in order to survive. Going out to a movie is an experience. People are more willing to pay for experiences rather than stuff (DVDs). So if cinemas can get serious about screening experience at a fair price, they might get the audience back, or at least stop the decline.
With the rebirth of Cosmos on TV, Neil DeGrasse Tyson and the team have brought science back into the mainstream. No longer is science confined to the latest puff piece on cancer research that is only in the media because a) cancer and b) the researchers are pressuring the funding bodies to give them money. The terms geek and nerd have stopped being quite the derogatory terms they once were. We even have science memes becoming as popular as Sean Bean “brace yourself” memes.
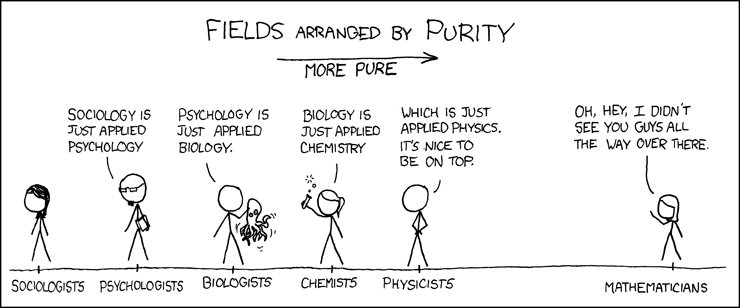
This attention has also cast a light on the scientific process itself with many non-scientists and scientists passing comment on the reliability of science. Nature has recently publishedseveral articlesdiscussing the reliability of study’s findings. One article shows why the hard sciences laugh at the soft sciences, with the article talking about statistical errors. I mean, have these “scientists” never heard of selection and sample bias? Yes, there is a nerd pecking order, and it is maintained through pure snobbishness, complicated looking equations, and how clean the lab-coat remains.
A Shocking Amount of Medical Research Is Complete Bullshit
#6 – Kinda true. There are two problems here: media reporting of medical science and actual medical science. The biggest issue is the media reporting of medical science, hell, science in general. Just look at how the media have messed up the reporting of climate science for the past 40 years.
Of course, most of what is reported as medical studies are often preliminary studies. You know: “we’ve found a cure for cancer, in a petri dish, just need another 20 years of research and development, and a boatload of money, and we might have something worth getting excited about.”The other kind that gets attention isn’t proper medical studies but are spurious claims by someone trying to pedal a new supplement. So this issue is more about the media being scientifically illiterate than anything.
Another issue is the part of medical science that Ben Goldacre has addressed in his books Bad Science and Bad Pharma. Essentially you have a bias toward positive results being reported. This isn’t good enough. Ben goes into more detail on this topic and it is worth reading his books on this topic and the Nature articles I previously referred to.
Many Scientists Still Don’t Understand Math
#5 – Kinda true. Math is hard. It has all of those funny symbols and not nearly enough pie charts. Mmmm, pie! If a reviewer in the peer review process doesn’t understand maths, they will often reject papers, calling the results “blackbox“. Other times the reviewers will fail to pick up the mistakes made, usually because they aren’t getting paid and that funding application won’t write itself. And that’s just the reviewers. Many researchers don’t do proper trial design and often pass off analysis to specialists who have to try and make the data work despite massive failings. And the harsh reality is that experiments are always a compromise: there is no such thing as the perfect experiment.
Essentially, scientists are fallible human beings like everyone else. Which is why science itself is iterative and includes a methods section so that results are independently confirmed before being accepted.
And They Don’t Understand Statistics, Either
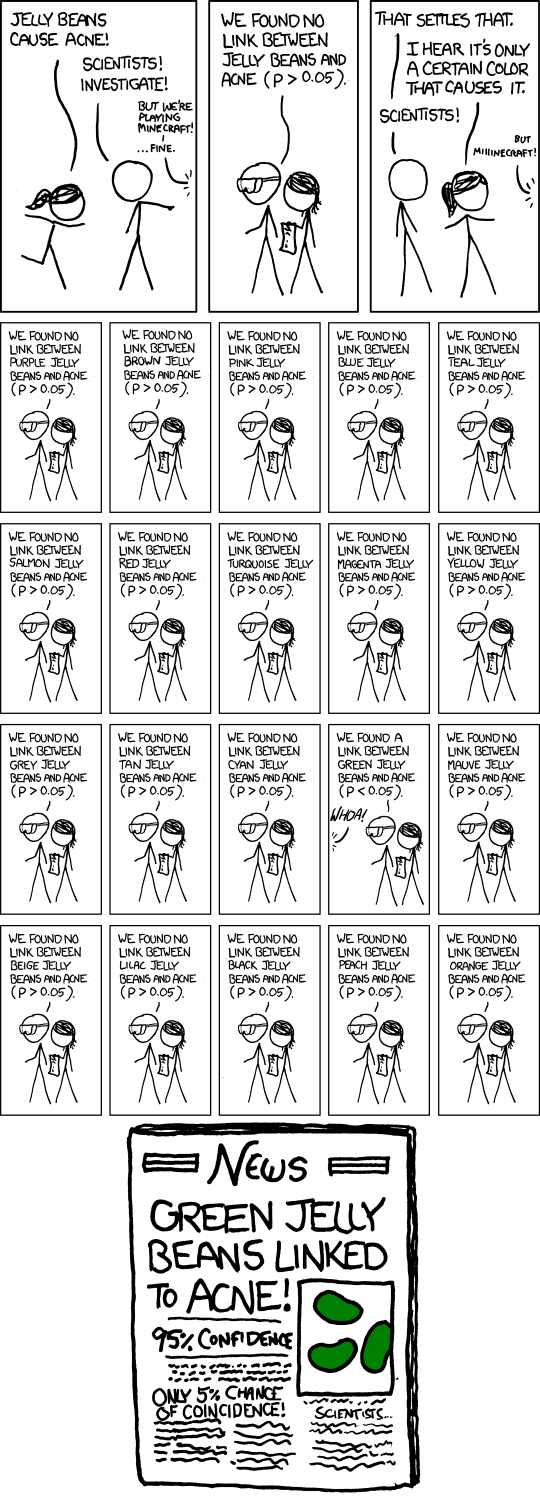
#4 – Kinda true, but misleading. How many people understand the difference between statistically significant and significance? Here’s a quick example:
This illustrates that when you test for something at the 95% confidence interval you still have a 1 in 20 chance of a false positive or natural variability arising in the test. Some “science” has been published that uses this false positive by doing a statistical fishing trip (e.g. anti-GM paper). But there is another aspect, if you get enough samples, and enough data, you can actually get a statistically significant result but not have a significant result. An example would be testing new fertiliser X and finding that there is a p-value of 0.05 (i.e. significant) that the grain yield is 50kg higher in a 3 tonne per hectare crop. Wow, statistically significant, but at 50kg/ha, who cares?!
But these results will be reported, published, and talked about. It is easy for people who haven’t read and understood the work to get over-excited by these results. It is also easy for researchers to get over excited too, they are only human. But this is why we have the methods and results sections in science papers so that calmer, more rational heads prevail. Usually after wine. Wine really helps.
Scientists Have Nearly Unlimited Room to Manipulate Data
#3 – True but misleading. Any scientist *could* make up anything that they wanted. They could generate a bunch of numbers to prove that, for an example of bullshit science, the world is only 6000 years old. But because scientists are a skeptical bunch, they’d want some confirming evidence. They’d want that iterative scientific process to come into play. And the bigger that claim, the more evidence they’d want. Hence why scientists generally ignore creationists, or just pat them on the head when they show up at events: aren’t they cute, they’re trying to science!
But there is a serious issue here. The Nature article I referred to was a social sciences study, a field that is rife with sampling and selection bias. Ever wonder why you hear “scientists say X is bad for you” then a year later it is, “scientists say X is good for you”? Well, that is because two groups were sampled and correlated for X, and as much as we’d like it, correlation doesn’t equal causation. I wish someone would tell the media this little fact, especially since organic food causes autism.
Other fields have other issues. Take a look at health and fitness studies and spot who the participants were: generally, they are university students who need the money to buy tinned beans and beer. Not the most representative group of people and often they are mates with one of the researchers, all 4 of them. Not enough participants and a biased sample: not the way to do science. The harder sciences are better, but that isn’t to say that there aren’t limitations. Again, *this is why we have the methods section so that we can figure out the limitations of the study.*
The Science Community Still Won’t Listen to Women – Update
#2 – When I first wrote this I disagreed, but now I agree, see video below. As someone with a penis, my mileage on this issue is far too limited. That is why it was only when a few prominent people spoke out about this issue that I realised science is no better than the rest of society. It hurts me to say that.
There is still a heavy bias toward men in senior positions at universities and research institutes, women get paid less, women are guessed to be less competent scientists, and apparently, it is okay to ogle female scientists’ boobs… Any of these sound familiar to the rest of society? This is gradually changing, but you have to remember what age those senior people are and what that generation required of women (quit when they got married, etc). That old guard may have influence but they’ll all be dead or retired soon where their influence will be confined to the letters to the editor in the newspaper. After seeing the video below, especially the way the question was asked, I think it is clear that the expectations for women create barriers into and through careers in science (the racism is similar and is one I see as a big issue). So it starts long before people get into science, then it continues through attrition.
Fast forward to 1:01:31 for the question and NDGT’s* answer (sorry, embed doesn’t allow time codes).
Recently there has been a spate of very public sexist science moments. Whether it be telling female scientists they should find a male co-author to improve their science, or Nobel Laureates who don’t want to be distracted by women in the lab, it is clear that women in science don’t get treated like scientists. Which is why I find the Twitter response to the Tim Hunt debacle, #distractinglysexy, to be exactly the sort of ridicule required. Recent events seem to imply at least repercussions are occurring now.
Scientists are meant to be thinkers, they are meant to be smart, they are meant to follow the evidence. They aren’t meant to behave like some cretin who hangs out on the men’s rights movement subreddit discussion. Speaking of which, watch science communicator Emily Graslie discuss the comments section of Youtube.
Here’s another from Thought Cafe and Dr. Renée Hložek.
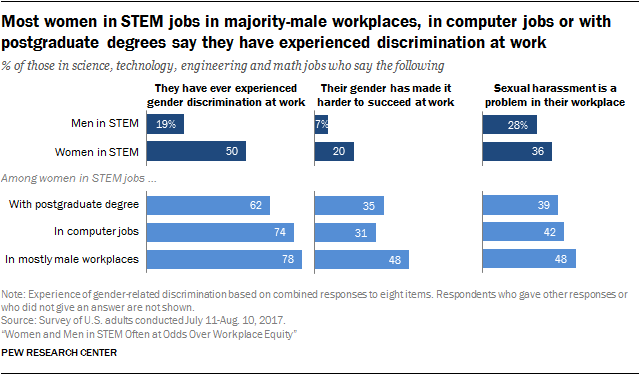
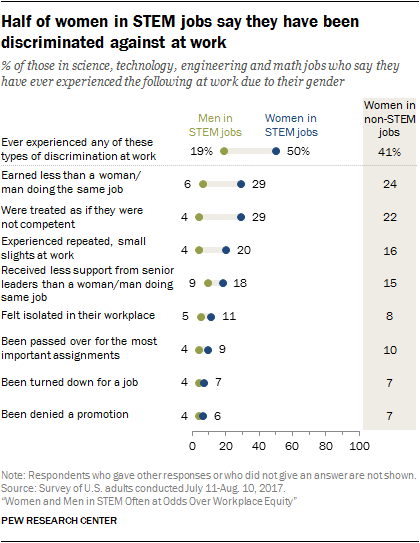
Update: After the first photo of a black hole was published, women in STEM were back in the headlines, with people wanting to again marginalise women in STEM – not to mention how the media love to promote the “lone genius” when science is a team thing. Vox had a great article on it which included some great graphs from Pew Research.
It’s All About the Money
#1 – D’uh and misleading. Research costs money. *This is why we have the methods section, so that we can figure out the limitations of the study.* Money may bring in bias, but it doesn’t have to, nor does that bias have to be bad or wrong. Remember how I said above that science is an iterative process? Well, there is only so big a house of cards that can be built under a pile of bullshit before it falls down in a stinky mess. Money might fool a few people for a while (e.g. climate change denial) but science will ultimately win.
Ultimately, science is the best tool we have for finding out about our reality, making cool stuff, and blowing things up. Without it we wouldn’t be, this article wouldn’t be possible, we wouldn’t know what a Bill Nye smack down looks like. Sure, there is room for improvement, especially in the peer review process and funding arrangements, and science is flawed because it is done by humans, but science is bringing the awesome every day: we have to remember that fact.
After a recent discussion about gun myths, I realised that my last blog post hadn’t covered anywhere near enough of the myths that are floating around (this article will mainly be about US guns, but parallels from the resources and science cited can be drawn to other countries). This is obviously because stuff is much easier to make up than to research, just ask Bill “tides go in, tides go out” O’Reilly. One of the big problems with research in the US on guns is that the National Rifle Association has effectively lobbied to cut off federal funding for research and stymieing data collection and sharing on gun violence. As a result there are a lack of hard numbers and research often tends to be limited in scope. Scope: get it? So like a lost rabbit wandering onto a shooting range, or a teenager wearing a hoody, it’s time to play dodge with some of these claims.
Myth: Guns make you safer, just like drinking a bit of alcohol makes you a better driver.
The myth I hear the most often is that guns make you safer; just like the death penalty is a great deterrent, surveillance cameras stop crime, and the internet is a good source of medical advice. The problem with this myth is that people like having a safety blanket to snuggle. What they don’t realise is that guns don’t make you safer, they make you 4.5-5.5 times more likely to do something stupid to someone you know and love than be used for protection.
I want to be clear here: there’s nothing wrong with going shooting at the range, or hunting vermin. The problem is thinking that you can use a gun for self-defence, when it actually makes the violence problem worse. That gun escalates the violence because people have it there: why not use it? To wit the criminals enter into an arms race and a shoot first policy.
Owning a gun has been linked to higher risks of homicide, suicide, and accidental death by gun. For every time a gun is used in self-defense in the home, there are 7 assaults or murders, 11 suicide attempts, and 4 accidents involving guns in or around a home. 43% of homes with guns and kids have at least one unlocked firearm, and in one experiment it was found that one third of 8-to-12-year-old boys who found a handgun pulled the trigger, which is just plain unsafe.
As for carrying around a gun for self-defence, well, in 2011, nearly 10 times more people were shot and killed in arguments than by civilians trying to stop a crime. In one survey, nearly 1% of Americans reported using guns to defend themselves or their property. However, a closer look at their claims found that more than 50% involved using guns in an aggressive manner, such as escalating an argument. A Philadelphia study found that the odds of an assault victim being shot were 4.5 times greater if they carried a gun. Their odds of being killed were 4.2 times greater.
It is even worse for women. In 2010, nearly 6 times more women were shot by husbands, boyfriends, and ex-partners than murdered by male strangers. A woman’s chances of being killed by her abuser increase more than 7 times if he has access to a gun, and that access could be the woman keeping one around just in case her attacker needs it. One US study found that women in states with higher gun ownership rates were 4.9 times more likely to be murdered by a gun than women in states with lower gun ownership rates; funny that.
There is also the action hero delusion that often gets trotted out when talking about guns for self-defence. The idea is that everyone is a good guy, so give them a gun and you have a bunch of action heroes ready to fight off the forces of evil. This has worked so well that all governments are thinking of getting rid of the military….
The reality is that the average person is not an action hero and would fail miserably in a high stress situation with actual bad guys. You only have to look at the statistics:
Mass shootings stopped by armed civilians in the past 30 years: 0
Chances that a shooting at an ER involves guns taken from guards: 1 in 5
I’ve seen several examples cited of “citizens” shooting someone who looked intent on killing everyone they could (with a gun…). But in every instance the “citizen” was actually an off-duty police officer, or a person in law enforcement, or someone in the military. In other words, the people who stop mass shootings or bad-guys with guns, are trained professionals.
There have also been a few studies done that claim X million lawful crime preventions, therefore guns must be good; notably by researchers Lott and Kleck. To say that their research is flawed is like saying Stephen King has sold a few books. Lott’s work has been refuted for extrapolating flawed data. Kleck’s research has similarly been refuted by many peer reviewed articles:
“The myth of millions of annual self-defense gun use: A case study of survey overestimates of rare events” Chance –American Statistical Association, 1997
Myth: Guns don’t kill people, people kill people, quite often with a gun, because punching someone to death is hard work.
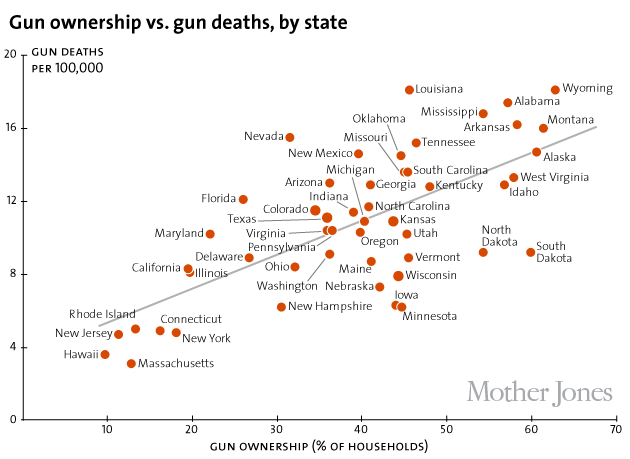
If this myth were true we wouldn’t send troops to war with weapons. I get where people are coming from with this myth, because the gun itself is an inanimate object and is only as good or bad as the person using it. Yes, I did just quote the movie Shane: thanks for noticing. But here is the thing, in a society we are more than just a bunch of individuals, we are a great big bell-curve of complexity. So when you actually study the entire population you find that people with more guns tend to kill more people—with guns. In the US, states with the highest gun ownership rates have a gun murder rate 114% higher than those with the lowest gun ownership rates. Also, gun death rates tend to be higher in states with higher rates of gun ownership. Gun death rates are generally lower in states with restrictions such as firearm type restrictions or safe-storage requirements.
Gun deaths graph: The three states with the highest rate of gun ownership (MT, AK, WY) have a gun death rate of 17.8 per 100,000, over 4 times that of the three lowest-ownership states (HI, NJ, MA; 4.0 gun deaths per 100,000).
The thing is that despite guns being inanimate objects, they affect the user/owner’s psyche. It’s like waking up one morning with a larger penis or bigger boobs: you not only want to show them off, you act differently as a result. Studies confirm this change in behaviour. Drivers who carry guns are 44% more likely than unarmed drivers to make obscene gestures at other motorists, and 77% more likely to follow them aggressively. Among Texans convicted of serious crimes, those with concealed-handgun licenses were sentenced for threatening someone with a firearm 4.8 times more than those without. In US states with Stand Your Ground and other laws making it easier to shoot in self-defence, those policies have been linked to a 7 to 10% increase in homicides.
Now people also like to try and red herring the argument against guns by pretending that video games or mental health is the problem. The NRA tried to claim video games were to blame after the Newtown shootings. Of course we’d be able to see this relationship by looking at gun ownership versus video game playing, like by comparing the USA to Japan.
Myth: They’re coming for your guns to stop our freedom and tyranny and democide and Alex Jones said so and aliens made me do it!
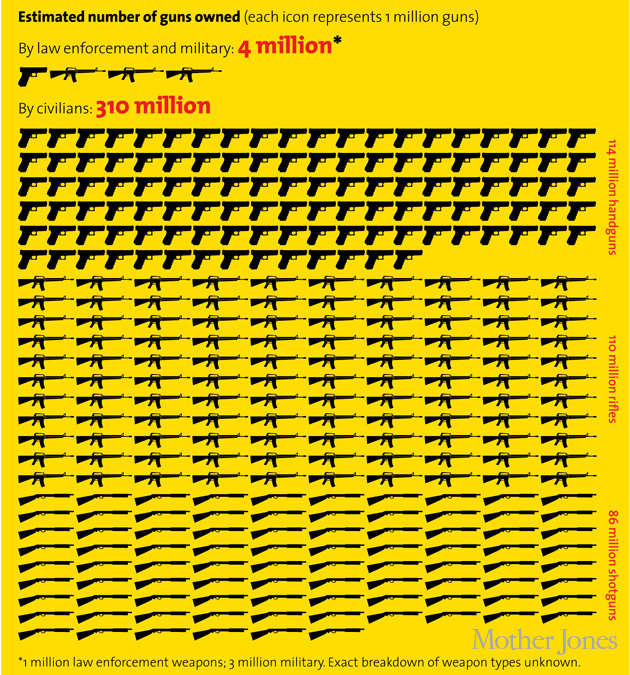
As I stated above, the statistics on guns and gun violence is hazy. No one knows the exact number of guns in America, but it’s clear there’s no practical way to round them all up (never mind that no one in Washington is proposing this). Those “freedom” loving gun owners – all 80 million of them – have the evil government out-gunned by a factor of around 79 to 1. If government were coming for the guns, you’d think they’d have done so before being this grossly out-gunned.
Yes, 80 million gun owners is a minority! I find it interesting that from 1989 to 2000 there was a decline in gun ownership of 46% to 32%. Now the decline in ownership rebounds to hover between 34 and 43% for 2000-2011 (notably the high point in 2007 was after the Virginia Tech shooting which the NRA did a lot of campaigning around), which shows why the decline didn’t continue. Now compare those rates of ownership to the recent report from the US Bureau of Justice Statistics sums up the rates of gun violence. You can clearly see a decline in gun violence from 1993 to 2000 before a plateau that has pretty much held since. This is confirmed by other studies. This is an important take home point: all the research shows violence and gun violence is on the decline. The idea that people need a gun for protection is becoming more and more ridiculous. This is despite the global decline in violence, and trends seen in countries like Australia (more Aussie stats here). On a side note, in the last lot of statistics you see that the more female, educated, non-white, and liberal you are, the less likely you are to own a gun.
So scare campaigns may work to boost sales of guns for a while, but overall, most people don’t want or need a gun. The long term trend has nothing to do with the government coming for the guns and everything to do with people realising they don’t need one and prefer to read a good book, or watch a movie, instead of going to the range.
The simple fact is that more guns in society is the best predictor of death, thus it is time to rethink the reasons for owning a gun, especially if that reason is in case you have to John McClane a situation.
Ever since Spielberg made us scared of seeing any more Indiana Jones films, people have felt better about blaming him for the hysteria around sharks.
Recently in my home state of Western Australia there has been a decision made to cull sharks because some people have been killed by them. Clearly we should blame sharks for just wanting a hug and not humans for dressing up like shark food. This is a stupid decision and I’m about to outline why we can’t even tell if there have been more shark deaths, let alone whether a cull would actually work, let alone whether you’d know if the cull does anything. It all comes down to statistics. Well, that and media beat-ups to sell advertising space.
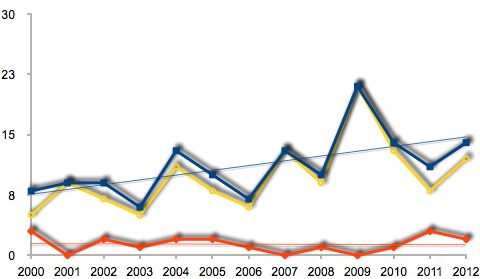
You’d honestly think that there had been a change in the number of people dying in Australia from shark attacks in order to justify a shark cull. Well, the official stats show there hasn’t been an increase in deaths from shark attacks. In fact the deaths are so low the noise around the long term average of 1.38 deaths per annum (2000-2012), that any increase or decrease in deaths are impossible to assign any significance to (see chart below). Three deaths in a year (2000): could be an anomaly. Zero deaths the year after (2001): likely to be regression to the mean. Number of deaths from the most ferocious animal on the planet: bees; 10 per year.
Graph of Aussie shark attacks 2000-2012. Blue is total encounters, yellow is non-fatal, red is fatal. Trend lines for total and fatal.
What you do see in the data is a slight increase in the number of attacks. If you look at the number of attacks and fatalities since 1900, there has been a general increase in the number of shark attacks, but a decrease in the fatalities from shark attacks. It’s almost as though there are more people in the world and more of them bobbing up and down in the ocean in seal costumes, possibly on a tasty cracker.
International Shark Attack File data, Florida Museum of Natural History
Now this is interesting for the world and Australia, as it appears that despite our best efforts as humans, sharks aren’t taking revenge for the 100 million of them we kill each year. But this is about a shark cull in Western Australia: what’s happening there? Well, these tables say it all really:
Western Australia accounts for ~13% of shark attack deaths. When we look at 2012 data we see that WA is having a greater proportion of the Australian attacks and accounts for all the fatalities in Australia. The terms “bigger population”, “longer coastline”, “more cashed up bogans“ come to mind.
So there is no actual proof that there are any more deaths occurring from shark attacks, definitely no trend toward more deaths, but a significant increase in the number of media reports on those deaths (citation needed). Even on a state by state basis there isn’t any death trend.But there is a trend towards more shark incidents. What we are actually seeing is an increase in the number of people dressing up like seals/shark food (scuba divers and surfers).
Circumstances affecting shark / human interactions:
The number of shark-human interactions occurring in a given year correlates with human population increases and the amount of time humans spend in the shark’s environment. As Australia’s population continues to increase and interest in aquatic recreation rises, it would realistically be expected that there will be an increase in the number of shark encounters.
Let’s put that in perspective, Australians have a 1 in 3,362 chance of drowning at the beach and a 1 in 292,525 chance of being killed by a shark in one’s entire lifetime. In Australia there are 1.38 deaths per year from sharks, 121 deaths per year from drowning at the beach, and1,193 deathsper year from driving. We’re more likely to die from all the stupid shit we do, than from sharks. So why have a shark cull?
There is no real reason to have a shark cull. We already kill 100 million of the things annually anyway. What we actually need to do is look at where the sharks are looking for food, has their food moved, if so due to what, and are we seeing less shark food available such that sharks are looking for alternate foods. The shark cull with drum lines and nets is actually likely to kill off dolphins, turtles, rays, and endangered shark species, which is why fisheries researchers don’t support the cull.
Update: I neglected to mention that other states in Australia have been using baiting and nets, in the case of Queensland, since 1962, and since 1937 in New South Wales. Reports are not complimentary of the Queensland nor New South Wales programs. To quote:
…the Fisheries Scientific Committee is of the opinion that the current shark meshing program in New South Wales waters’ adversely affects two or more threatened species, populations or ecological communities and could cause species, populations or ecological communities that are not threatened to become threatened.
And (okay, I’ve cherry picked this a bit, read the whole report on how we are overfishing, killing shitloads of sharks, destroying the fisheries and adding baiting on top of this):
The main pressures on grey nurse sharks appear to be fishing activities and shark control programs……. The biological susceptibility of sharks to over fishing, evidence for increasing fishing pressure and lack of information have given rise to increasing concern about the sharks and rays of the Reef.
Essentially shark baiting, whilst paling in comparison to the 100 million sharks killed for their fins annually, is another pressure that endangered species don’t need. Especially when the baiting is still killing other endangered animals, not just sharks.
The big take home from this infographic is that readers are more interested in reading, not on the format it comes in. I also found it interesting that people read slower on an e-reader (which I’d guess is because the screen is smaller and requires more ‘page turns’ which breaks reading flow) yet those using e-readers read an average of 9 more books per year (24 vs 15).
In summary: reading is good, go and enjoy a good book.
There are some interesting claims being levelled in the publishing industry about the death of books (rubbish), that publishers are going broke (only if they messed up) and that the industry is in turmoil (only when scaremongers keep saying it is). Well, the infographic below highlights some statistics on the US book industry – I think I’m going to stop calling it the publishing industry, maybe reading industry is more appropriate. The final figure is the one that everyone should quote the next time a smaller or non-existent advance is offered to authors, or royalty rates are lowered, or high book prices are justified.
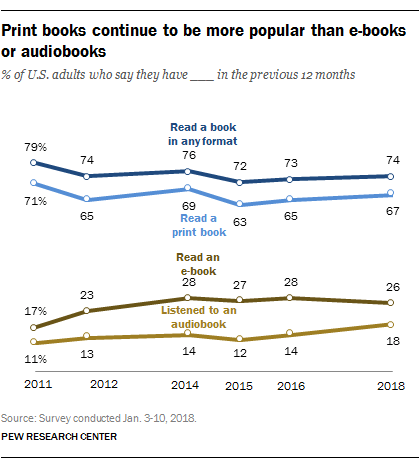
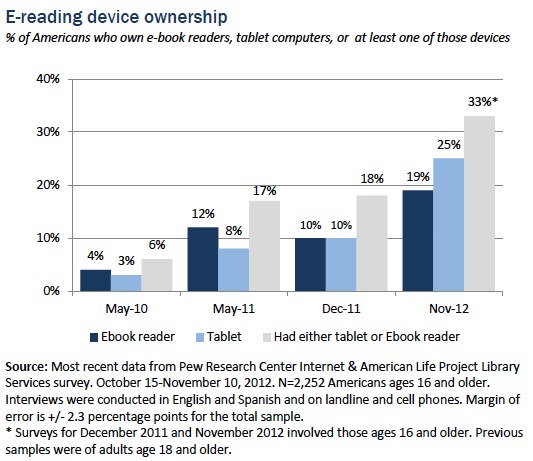
I’ve just come across some interesting research on reading habits by the Pew Research Center. It shows what many readers already knew, that e-books continue to grow in prevalence for readers. But there are also less readers. Although, I will state that comparing 2012 to 2011 and drawing conclusions about people who have read at least one book is always troubling. Might as well be comparing New Year’s weight loss programs prior to February first.
Also: One book? In a year? That isn’t a reader, that’s someone who got an unwanted Xmas present.
Anyway, in 2012 75% of US adults (+16) had read at least one book, down 3% on last year. Print books were generally less popular in 2012 across all age groups not still in school (I guess students get to count class assigned books in a survey), and were read by 67% of US adults, down 5%. E-books were 7% more popular, with 23% of adults having read one in 2012, with all age groups embracing them, especially in the 30-49 age bracket. Audio books were slightly more popular (2%) at 13% in 2012, which would be interesting to relate to the rise of Audible and similar online audio book businesses.
This slideshow requires JavaScript.
I guess now the question is, how do these data compare to avid readers? I’m betting avid readers have a closer split of ebooks to paper books in their reading.
A while back I wrote a post on how sharks aren’t the deadly monsters attacking people all the time that we think they are. Now I’m not suggesting that we all go and hug sharks, they only like to be touched by cleaning fish, nor that we jump in to swim with them, they play tag far too roughly for delicate humans. What I’m suggesting is that we really need to start worrying about stuff that is actually a concern rather than stuff that is just wild gesticulations in front of a camera for ratings.
So here is a list of things that kill more people than sharks annually:
There are a lot of guns in the world. The figure is something like 639 million firearms, or to put it another way, one gun for every 9 people on the planet. Yet the average person knows diddly squat about guns. People probably have a better idea of how Nicki Minaj managed to become a star than express knowledge about guns. Most of our knowledge is likely to come from movies:
Or professional Russians:
As an author I really wanted to make sure I didn’t base my gun knowledge upon misinformation, otherwise I’d have to work as a reporter covering the gun debate. So here are a few myths to be busted.
Machine guns are not monsters of death
They may fire great big bullets at hundreds of rounds per minute but machine guns really are given the fashion magazine airbrushing treatment. A great big gun letting off a whole lot of explosions in a short amount of time has a habit of getting hot. Really hot. We’re talking change the barrel over every minute hot! Yes, that’s right, at the maximum rate of fire your machine gun needs a new barrel every minute to keep firing without causing problems – which I imagine as a gigantic explosion like Bugs Bunny sticking his finger in the end of Elmer Fudd’s shotgun. But it isn’t just the barrel changes, most of the time you aren’t actually firing the machine gun at people, you’re firing it at super mean looking inanimate objects, or as the military call it, suppressive fire (250,000 rounds for one kill!!!). Essentially the machine gun is a tool that performs a very different role from the one gun noobs think it does. Well, unless you don’t mind the thing catching on fire (yes, I know that isn’t technically a machine gun):
Guns aren’t really death machines
For death machines, these gun things really don’t kill enough people. In science we talk about effects, rates and how to blow up stuff with the things you find under the kitchen sink, as such it is hard to look at the gun deaths and gun injury rates and not think guns kinda suck at their job. The USA use guns to kill roughly 30,000 people a year, one third of those are homicides, but that is less than half the people they injure with guns, roughly 65,000. But that isn’t really fair, because not every time a gun goes off is it being used to shoot at someone else or a particularly nasty piece of paper. If you just look at homicides and attempted homicides, guns are still only getting the job done 21% of the time.
Guns suck for self defence
Not everyone can have Chuck Norris camped out in their house for self defence, nor carry Steven Segal around where-ever they go. But as mentioned above, guns really do suck at their job. Whether it is only being 23% effective in legal interventions, or the fact that you’re 4.5 to 5.5 times more likely to be shot for carrying a gun, you really start to think running away looks like a better option, even if you are as fat as Steven Segal has gotten lately.
Handguns are about as accurate as the horoscopes
A handgun is a really convenient weapon to carry around with you, but if the side of a barn is more than a few metres away, you’re not particularly likely to hit it. Even cops can’t hit much with these things, even when the bad-guy is less than 15m away. Half the problem is that bad-guys shoot back, which means you don’t stand around collecting holes, you run for cover, which really ruins your accuracy. But I’ve already mentioned that guns suck at their job, well, your handgun might hit the bad-guy 55 times and still not kill them.
Guns sure do help kill people
As much as guns suck at their job, as I’ve just pointed out, guns still do a better job of killing than many of the other methods we’ve devised for killing each other. Sure, people love their tools to kill one another, but guns are a really good tool to use for killing one another. I can’t wait to see the military being sent off to war with hammers and cars instead of a gun.
Being shot doesn’t mean you can fly
The trick to flying is throwing yourself at the ground and missing. So being shot clearly can’t make you fly. Don’t know why people think that shooting someone can disobey this simple fact, let alone Newton’s Laws of Motion. But what good is a trope if it isn’t always on display?
Semi-auto rifles are not assault rifles
Every time someone refers to a semi-auto rifle as an assault rifle, or worse, the made up term assault weapon, a puppy dies. You don’t want all the puppies to die do you? Well then, it is time to learn the difference between the military configured select fire rifle, called the assault rifle, which is capable of fully automatic and (sometimes) burst fire, and the civilian one trigger pull, one shot, semi-automatic rifle. I know, they may look the same to the untrained eye, but some people think cars are all the same thing too.
Mags, clips, high capacity…
While we’re on the topic of rifles, I have a dictionary and an abacus for people talking about magazines, clips and high capacity mag clips. A magazine is something you read, a clip is something you watch and high capacity is a Japanese train at rush hour. Different guns have different sizes of magazines (which may or may not be loaded with a clip), which means 30 rounds may be high capacity for one gun and normal capacity for another. Also, when one of these these rifles go through 700 rounds per minute and even soldiers only carry 210 rounds, from a standard 30 round magazine, then no gun fight is really lasting that long.
It’s a suppressor not a silencer!
Remind me, is +120 decibels loud or quiet? It sure is a lot quieter than a normal gunshot sound (+160db), but calling it “silent” is like calling bagpipes a little annoying. When the best suppressors on the smallest calibre weapons still manage to be as loud as a jack hammer or AC/DC, then suppressors have again gotten the Hollywood make-over. But 30db is a decent drop from ear splitting to “say what” territory, so I’d say these things should be compulsory.
There is no smell of cordite
If someone describes the smell of cordite in the air after a gun fight, you either know that the book is set before 1950 or that there is a sub-plot about a time traveller who comes from the past to assassinate a future self. It seems really odd that so many books use the time traveller sub-plot, because it is usually a one off. It would be far more interesting if this was built upon more, maybe have Gengis Khan show up to knock down a wall, or something, as well.
Less guns are a good idea
Shooting is fun, hunting is very primal, but at some point your neighbours start to get worried when you look more like you are going to war than to the shooting range. Aside from guns sucking for self defence, they also suck at not shooting your loved ones, are handy for suicide, and unless you are in a warzone, more guns in society equals more gun violence. But it is also worth thinking about what gun figures actually mean, like 300 million guns in the US, enough for one for every American despite there being only about 80,000 gun owners. Sounds like a lot, but that means each gun owner has a rifle, a handgun and a shotgun, which is clays, targets and pistols at the local range on the weekend. Perfectly reasonable to go shooting, just not at your local school.
Actually, the phrase “hot off of the presses” is rather antiquated now. News stories that are breaking generally hit electronic mediums, or in some cases, such as celebrity gossip, they hit the TV and radio mediums. Interesting research or data is normally promoted virally via Twitter and the like. Should we have a new phrase like “just blogged” or “trending tweet” instead?
Back to the survey. While not all of us live in the USA, despite what some American congress-people might say, their trends in reading can be seen as indicative of what is happening elsewhere or is likely to happen elsewhere. The Pew Institute have done a pretty decent survey, it would be great if a few others were done for other countries.
What I found interesting was the growth in e-books and e-readers. There are further breakdowns in the full reports about why the change is happening, but suffice to say, e-books have many advantages over paper, despite paper books still being the most popular reading format.
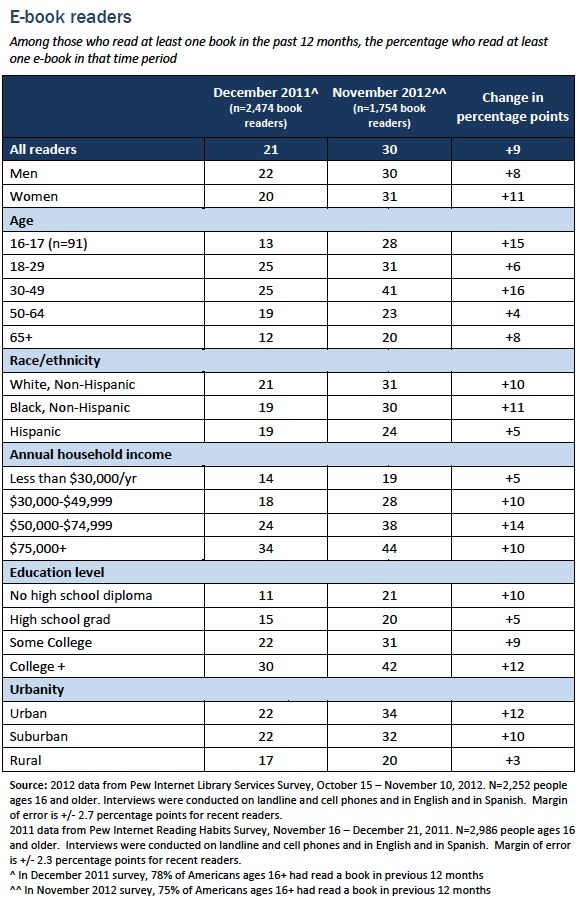
We can see a growth of 9% in people reading e-books during 2012, up from 21% to 30%. In terms of age demographics we can see that most age groups are taking up e-books, although the big growth is still in the middle age (30-49) group.
The next point of interest was who the readers were and how much they read. We can see that there is still a sizeable chunk of the community that don’t read and another chunk that pretend to read. I’d hazard a guess that light readers read non-fiction and the latest talked about bestseller only. Because they never really read good books it takes them ages to read one book and thus don’t read often.
Among those ages 16 and older who had read a book in the past 12 months:
8% read 1 book
17% 2-3 books
16% 4-5 books
19% 6-10 books
18% 11-20 books
22% more than 20 books (this is my category)
And my final comment, women are still the readers. They make up a bigger proportion of book readers and they read more books. I have my own hypotheses as to why this is: boys are expected to like sport and reading is the opposite of sport; and reading doesn’t make you look as sexy as playing sport, so boys think you are less likely to get laid if you read. The big change I’d like to see, and this seems to be the case with e-readers and e-books, is for the average reader to read more books in a year, even if it is only so that people read the book before they make the movie of it.
I seem to be finding a bunch of cool infographics recently, they are the future of communication (warning, sarcasm may be in affect here). It is always interesting to see what the status of sales, especially e-book sales. Personally, I see the e-book becoming the new paperback within a few years, and I also think that backlists will be all e-books. What will be really interesting is whether authors will be the one controlling their backlists or whether publishing houses will want to grab hold of those. Then it becomes a case of what rates are paid on backlist, because the sunk costs are a frontlist issue, so you would expect a greater author share of sales (although it could be argued that sunk costs are sunk, thus trying to recoup those costs as part of the sale price is bad economics).


